Carmageddon: Tracking New York City’s Transportation Recovery

COVID-19 changed every facet of New York City life, and transportation is no exception. The effects of this crisis are far from over, and according to research by Transportation Alternatives, if we do not act fast, New York City’s recovery is at stake.
We’ve tracked the data related to transportation as New York has reopened, and one thing is clear: the city is headed for conflict. As more commuters opt to drive, and little accommodation is made for the safety and efficiency of those who do not, New York could soon see a gridlocked, exhaust-choked, and crash-laden Carmageddon.


Changes in ridership and bridge and tunnel crossings are based on percent change versus 2019 average Saturday, Sunday, and weekday numbers.
Cars Dominate NYC’s Recovery: All modes of travel fell significantly as New York City shut down in mid-March. Between March and April, subway ridership dropped 92 percent, bus ridership dropped 78 percent, and bridge and tunnel crossings dropped 69 percent. While bus and subway ridership both remain below pre-COVID levels, bus ridership has rebounded substantially and today is down only 35 percent compared to the subway, which remains down 74 percent in August. But by and large, New Yorkers are opting to drive. Bridge and tunnel crossings approached pre-COVID levels by June. Even though most New Yorkers are not commuting to work, traffic levels are only down nine percent from last year.
When New York City first shut down in March, as would be expected, all forms of transportation ground to a near-halt. What is interesting is what has returned as New York City begins to reopen.
Between March and April, New York City’s subway system showed a huge dropoff in ridership and has since shown almost no recovery. The same is true of local rail: Metro-North, Long Island Rail Road, New Jersey Transit, and the PATH train have all failed to rebound.
In the same period, there was an equivalent plunge in bridge and tunnel crossings. However, these numbers have rebounded almost completely. The amount of driving in New York returned to pre-COVID levels by June. Further reinforcing this trend, today, bridge and tunnel crossings are barely below 2019 levels.
Notably, bus ridership — which again took an equivalent plunge when the city shut down — rose more than subway ridership. It appears that post-pandemic New Yorkers trust the above-ground, windows-open potential of the bus to a greater degree than the subway.
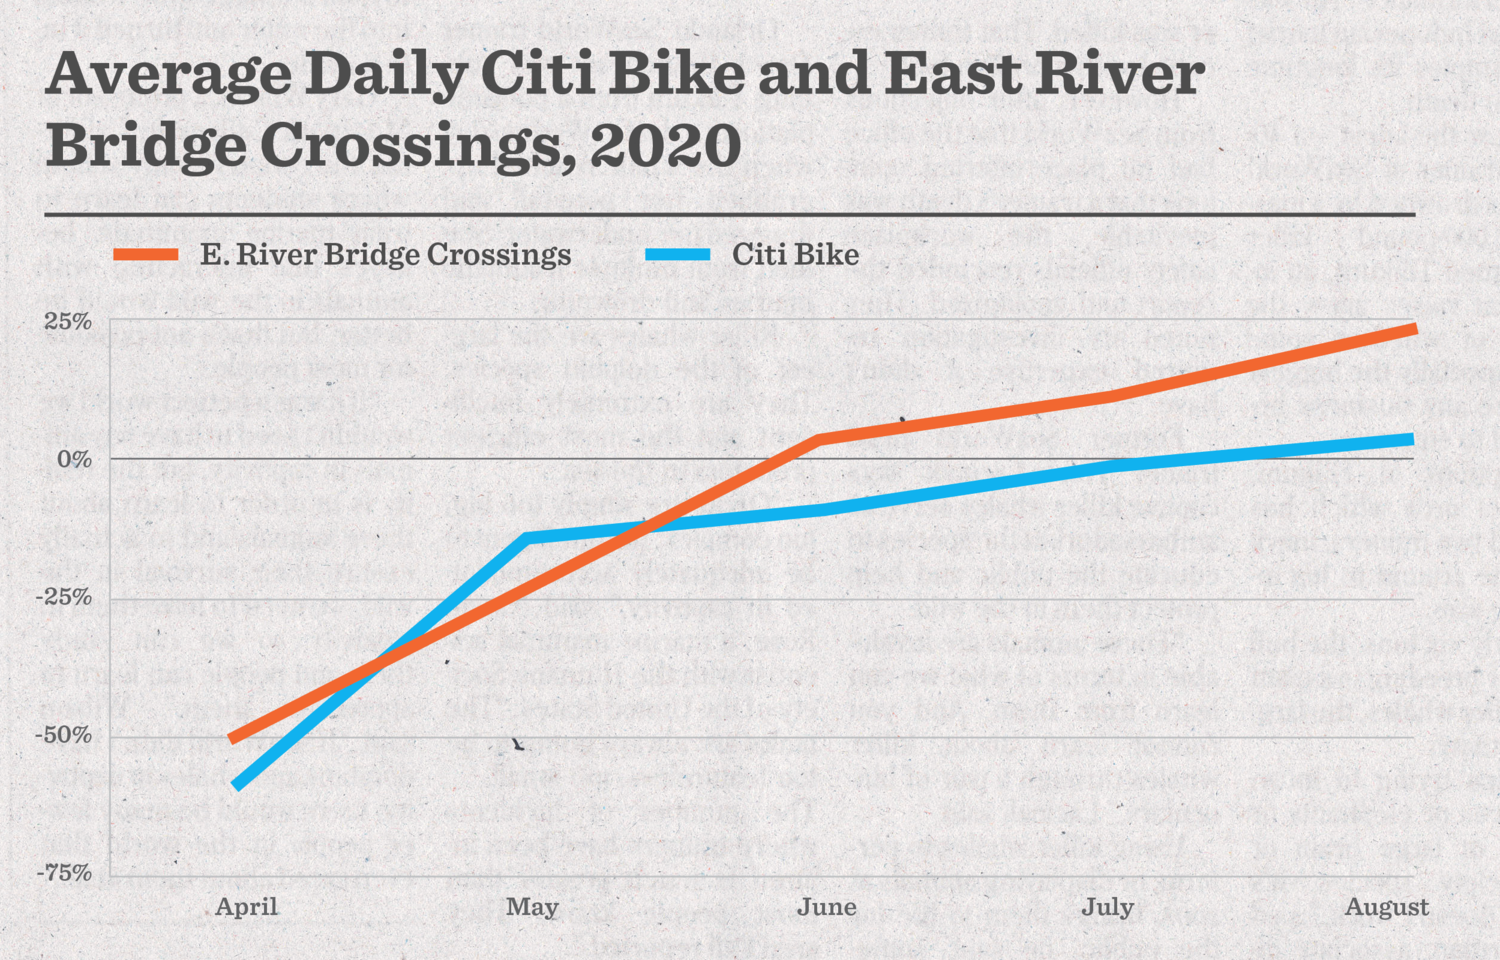
East River Bridge crossing data is based on automated bridge counts from the NYC Department of Transportation representing change in counts from 2019 to 2020.
Bikes Still Booming: New Yorkers are biking more than ever. Even though most New Yorkers are not commuting to work, in August, the number of daily weekday bike crossings over the East River was 23 percent higher than this time last year. Citi Bike use also rose, surpassing last year’s daily ridership for August, again even though most New Yorkers are not commuting to work as they would have been at this time last year.
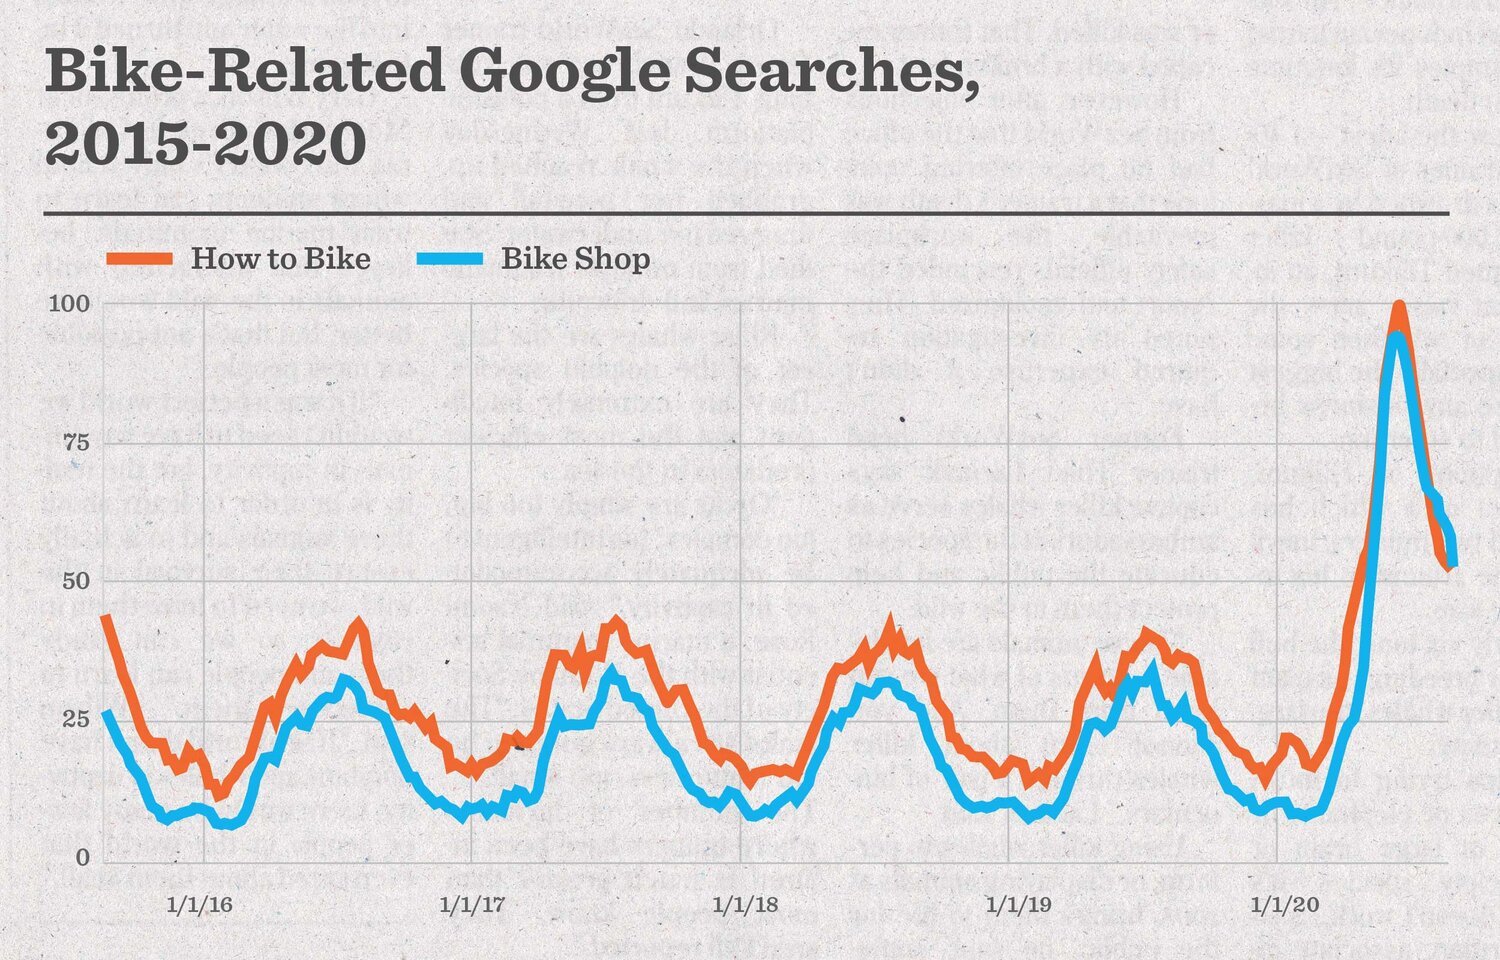
Google Trends numbers represent search interest relative to the highest point on the chart for New York City in the last five years. A value of 100 is the peak popularity for the term. A value of 50 means that the term is half as popular.
The Google Search Bike Boom: Google searches for “how to bike” and “bike shop” were two and half times higher this summer than anytime in the four years prior, indicating new cyclists on the roads. These have since declined, potentially indicating a missed opportunity by New York City to encourage and retain new cyclists.
Bicycling has also risen as a favorite form of transportation for New Yorkers. While Google searches for “how to bike” and “bike shop” fluctuate annually with the seasons, in April of this year, the searches reached an all-time high, with the former maxing out at its highest possible measure. While Citi Bike use fell nearly as much as the bus in March (but not nearly as much as the subway), it has rebounded with enthusiasm, proving just how vital cycling is to New York’s transportation network. August’s Citi Bike ridership was at a record high for the month.
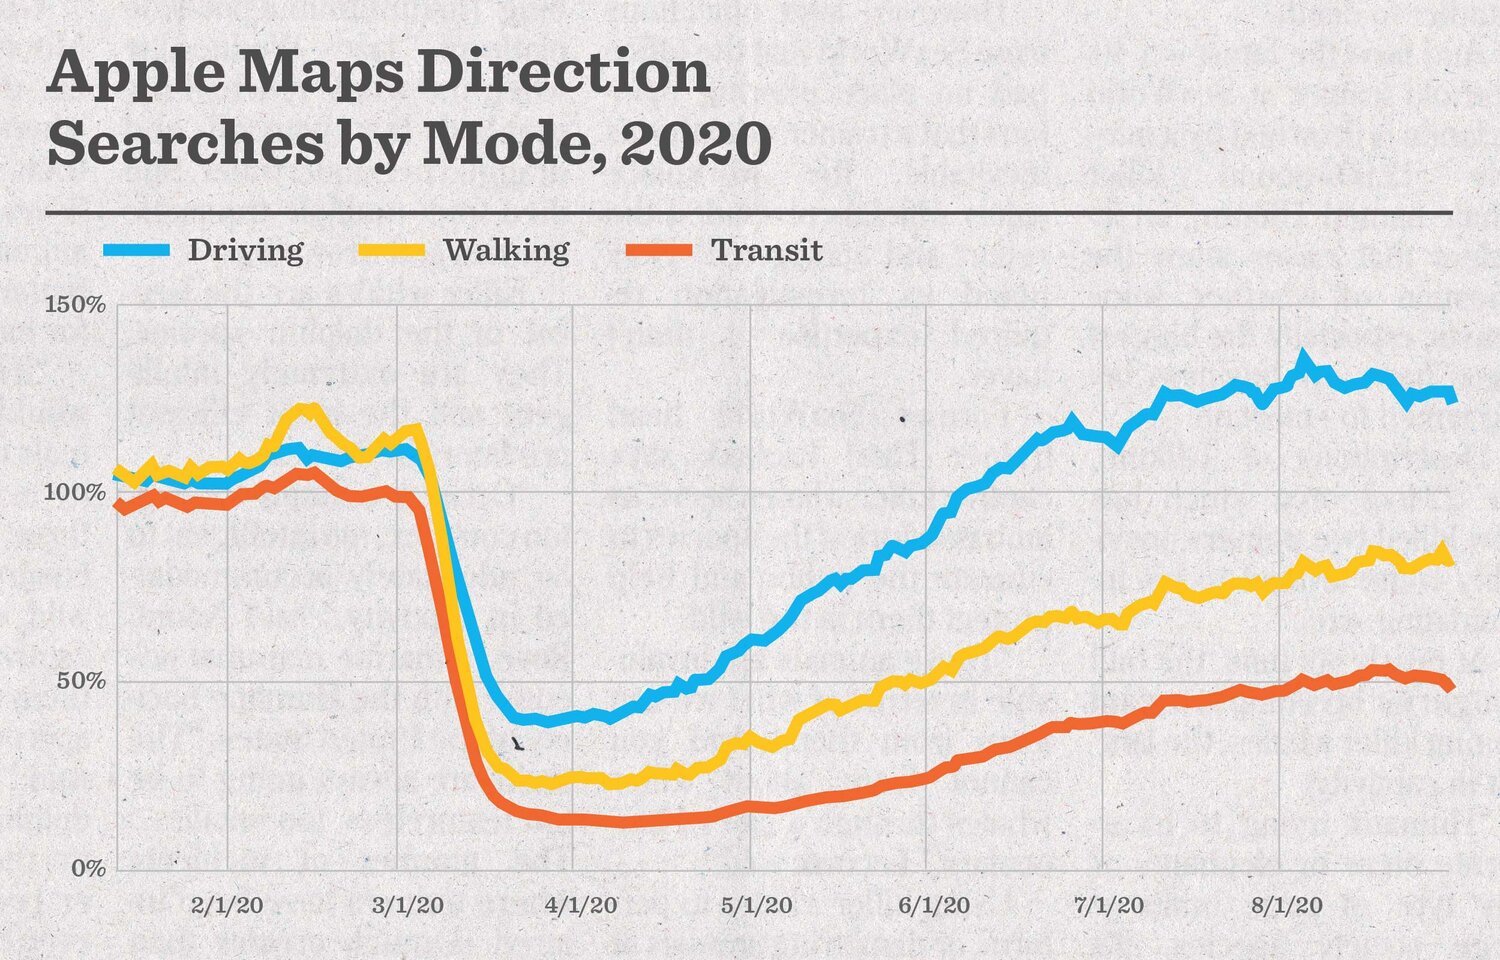
Changes in Apple Maps direction routing requests are based on data from Apple. Unlike other graphs that compare year over year changes, Apple is only sharing changes in direction routing by using January 2019 as its baseline.
New Yorkers Search For Driving Directions: Data from Apple Maps shows that requests for driving directions have soared as the city has reopened, surpassing their pre-COVID levels. This suggests that not only are more people driving, but there may be more inexperienced drivers out there. Even though most New Yorkers are not commuting to work, data from Apple Maps shows that requests for driving directions increased by 27 percent as the city reopened, surpassing pre-COVID levels, while walking direction searches are down 18 percent and transit directions down 50 percent. The gap between driving direction searches and walking / transit direction searches is growing.
Notably, the risk that driving poses to New Yorkers, in terms of both air pollution and crashes, has increased. Automated speed safety cameras, which issue 94 percent of all speeding tickets in the city, have shown a 67 percent increase over pre-COVID levels. But people are not only driving at increasing levels — and driving at dangerous speeds more than ever — but their cars continue to affect public health. Speeding increases the severity of crashes to deadly effect. Already in 2020, 76 motorists have been killed, more than in all of last year, when 68 were killed. And in April, New York City looked like it might finally be on its way to meeting some of its climate goals when air quality improved to 24 percent better than average. These gains have all been lost.

Average number of speeding tickets per day is based on data from NYC’s Open Data portal. The average number of tickets per day is realized by totaling the number of tickets issued a month and dividing by the number of days.
A Surge In Speeding: From February to August of 2020, there was a 67 percent uptick in the number of speeding tickets issued per day. This surge in reckless driving has proven dangerous, and is a growing threat as New York City reopens.
What does this all add up to? In short, the story of New York City’s transportation recovery — so far — is a recipe for Carmageddon. Driving is dangerously up in an already-congested city. Miraculously, after a decade of declining ridership, New Yorkers love the bus again. And after a decade of steady growth, bicycling is surging. These three facts have a frightening potential to clash on city streets, unless we act now. Increasing traffic congestion puts new cyclists’ safety at risk, and risks the loss of any gains in bus ridership by slowing down the efficiency of those buses.
To stem Carmageddon, the City of New York must invest in major capital improvements to build a citywide network of car-free protected bus and bike lanes. This is the only way forward.